Top of Page
- Links to move inside this page.
- HOME
- Investor Relations
- Integrated Report Portal
- Financial and Non-Financial Highlight
Financial and Non-Financial Highlight
Personnel data
IIJ (non-consolidated basis) Number of employees (By gender)
| FY2019 | FY2020 | FY2021 | FY2022 | FY2023 | |
|---|---|---|---|---|---|
| Male | 1,683 | 1,780 | 1,860 | 1,948 | 2,139 |
| Female | 356 | 403 | 441 | 487 | 541 |
| Female ratio (%) | 17.5 | 18.5 | 19.2 | 20.0 | 20.2 |
IIJ (non-consolidated basis) Number of hired employees (By gender)
| FY2019 | FY2020 | FY2021 | FY2022 | FY2023 | |
|---|---|---|---|---|---|
| Male | 174 | 171 | 155 | 179 | 269 |
| Female | 45 | 61 | 55 | 66 | 70 |
| Female ratio (%) | 20.5 | 26.3 | 26.2 | 26.9 | 20.6 |
IIJ (non-consolidated basis) Number of managerial positions and ratio of females in managerial positions
| FY2020 | FY2021 | FY2022 | FY2023 | FY2024 | |
|---|---|---|---|---|---|
| Number of managerial positions | 610 | 656 | 722 | 783 | 851 |
| Male | 582 | 620 | 681 | 734 | 787 |
| Female | 28 | 36 | 41 | 49 | 64 |
| Female ratio (%) | 4.6 | 5.5 | 5.7 | 6.3 | 7.5 |
- (*)The ratios of females in managerial positions of IIJ are as of April 1 of each fiscal year
IIJ (non-consolidated basis) Average Age and Years of Service
| FY2019 | FY2020 | FY2021 | FY2022 | FY2023 | |
|---|---|---|---|---|---|
| Average Age | 36.9 | 37.4 | 37.7 | 37.9 | 37.6 |
| Average Years of Service (%) | 8.1 | 8.8 | 9.1 | 9.3 | 9.2 |
IIJ (non-consolidated basis) Number and employment rate of employees with disabilities
| FY2019 | FY2020 | FY2021 | FY2022 | FY2023 | |
|---|---|---|---|---|---|
| Number of employees with disabilities | 46 | 51 | 56 | 64 | 64 |
| Employment rate of employees with disabilities (%) | 2.2 | 2.3 | 2.4 | 2.4 | 2.4 |
- (*)Based on the employment status report of persons with disabilities
- (*)On June 1st of each business year
IIJ (non-consolidated basis) Number of non-Japanese employees
| FY2019 | FY2020 | FY2021 | FY2022 | FY2023 | |
|---|---|---|---|---|---|
| Number of non-Japanese employees | 19 | 24 | 26 | 37 | 46 |
IIJ(non-consolidated basis) Ratio of employees using the childcare leave system and ratio of employees returning to work after childcare leave system (Male / Female)
| FY2019 | FY2020 | FY2021 | FY2022 | FY2023 | ||
|---|---|---|---|---|---|---|
| Ratio of employees using the childcare leave system (%) | Male | 14.7 | 26.4 | 24.6 | 33.3 | 53.5 |
| Female | 100.0 | 100.0 | 100.0 | 100.0 | 100.0 | |
| Ratio of employees returning to work after childcare leave system (%) | Male | 100.0 | 100.0 | 92.9 | 100.0 | 100.0 |
| Female | 100.0 | 100.0 | 100.0 | 100.0 | 93.3 | |
Average overtime per month
| FY2019 | FY2020 | FY2021 | FY2022 | FY2023 | |
|---|---|---|---|---|---|
| Average overtime per month | 21.3 | 24.7 | 28.1 | 27.7 | 26.2 |
Number of days and percentage of paid leaves taken
| FY2019 | FY2020 | FY2021 | FY2022 | FY2023 | |
|---|---|---|---|---|---|
| Average number of paid leaves taken per year (days) | 13.2 | 10.2 | 11.3 | 12.6 | 13.1 |
| Annual average acquisition rate (%) | 75.6 | 58.5 | 64.4 | 71.0 | 75.0 |
- (*)The number of days and rate of taken paid leaves above do not include special ones.
IIJ (non-consolidated basis) turnover rate
| FY2020 | FY2021 | FY2022 | FY2023 | |
|---|---|---|---|---|
| Turnover rate (%) | 3.6 | 4.2 | 3.8 | 4.6 |
Environmental data
Greenhouse Gas Emissions
| Scope of data collection | FY2021 | FY2022 | |
|---|---|---|---|
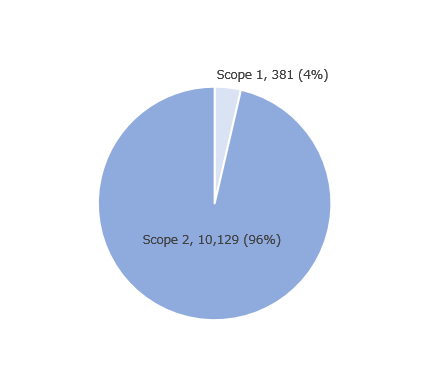
| Scope 1 emissions (t-CO2) | IIJ (Non-consolidated basis ) |
269 | 381 |
| Scope 2 emissions (t-CO2) | 13,819 | 10,129 | |
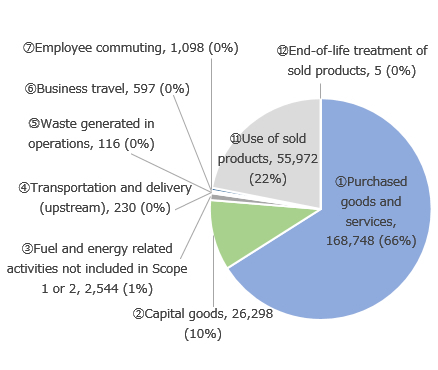
| Scope 3 emissions (t-CO2) | 234,687 | 255,608 |
- (*)The above emissions are calculated on a market-based method
IIJ (Non-consolidated basis) FY2022 Results (Unit: t-CO2)
Scope1+2
Scope3
- (*)Calculation is based on the Basic Guidelines on Accounting for Greenhouse Gas Emissions Throughout the Supply Chain(Ver2.3)(The Ministry of the Environment and Ministry of the Economy, Trade and Industry)
Percentage of renewable energy used in own data centers
| FY2021 | FY2022 | FY2023 | |
|---|---|---|---|
| Percentage of renewable energy | 14.3% (As of March 2022) |
46.1% (As of March 2023) |
49.8% (As of March 2024) |
PUE of own data centers(*1)(*2)
| FY2021 | FY2022 | FY2023 | |
|---|---|---|---|
| Matsue Data Center Park | 1.2 | 1.3 | 1.3 |
| Shiroi Data Center Campus | 1.4 | 1.3 | 1.4 |
- (*1)PUE(Power Usage Effectiveness) : Total data center facility energy usage divided by IT equipment energy usage
- (*2)Industry's Highest Level PUE : PUE 1.4 or lower (As of April 2024, the Agency for Natural Resources and Energy has set a benchmark index and target level of PUE as 1.4 or lower in the data center sector, and operators that achieve this are considered excellent energy conservation operators.)
Footer menu from here

- © Internet Initiative Japan Inc.
End of the page.